Nelson Capital Management


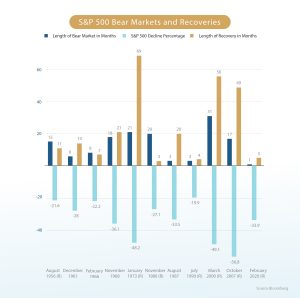
 The S&P 500 entered bear market territory on June 13th during what has become the worst start to a year in half a century. A bear market is defined as a 20% decline from a previous peak. From the middle of June through late August, stocks staged an impressive rally, recouping more than half the losses. However, the equity markets have retreated on recent comments from Federal Reserve Chairman Jerome Powell that the central bank is determined to bring inflation down, even if it means pain in the short term. Will this rally find its footing and be the start of another bull market, or was it merely a bear market bounce that ultimately fizzled and will lead to lower lows? History can offer some guidance as bear markets do not repeat themselves, but often rhyme.
Bear markets come in all shapes and sizes with various lengths and depths. The series of bear markets that accompanied the Great Depression starting in 1929 were the worst investors have ever seen. Several factors contributed to the depression that gripped the globe. As stocks rose precipitously during the Roaring Twenties, the use of margin loans to gain leverage to rising markets became popular. When stock prices started to decline, there was a rush for the exits, which led to catastrophic losses. A decline in consumer confidence weighed on spending and business investment, causing unemployment to reach over 24%. This culminated with four bank panics in the 1930s which were exacerbated by an inexperienced Federal Reserve tightening monetary supply to maintain the gold standard. Finally, the Smoot-Hawley Tariff Act which raised tariffs to 20% on imports, worsened the severity of the depression. From peak to trough, stocks declined 86% and it took over two decades to reclaim a new high, leaving an entire generation disenchanted with the stock market.
In the aftermath of World War II, price controls lapsed in 1946 and inflation that had begun building during the war increased rapidly. The Fed raised interest rates in response, which caused an 11-month recession with unemployment hitting 7.9%. The market declined 20% over about a year.
The Asian Flu pandemic in 1957 sparked a global recession while the Fed was tightening monetary policy to fight inflation at home. This caused an eight-month recession with unemployment touching 7.5%. The market saw a swift 20% decline over three months and rebounded the following year.
In the late 1960’s, government spending increased to fund the Vietnam War and domestic social programs, Medicare and Medicaid. Inflation hit 5.3% and the Fed raised its benchmark target rate to 5%, causing an 11-month recession with unemployment at 5.9%. The market declined over 25% in 1970 and rebounded later that year.
In 1973, the OPEC oil embargo caused the price of oil to spike, driving inflation higher than 12%. The Fed raised interest rates in response, causing a recession, and unemployment reached 9%. The S&P 500 tanked 48%, but consumers had yet to see peak inflation. The market rebounded in 1980, but by that point, inflation had reached nearly 15%. This led Paul Volcker, the Chair of the Federal Reserve at the time, to “break the back of inflation” by raising rates to 20%, which caused a recession and drove the unemployment rate over 10%. The S&P 500 fell 26% over the next year and a half, but the market rebounded quickly in 1982.
 The dot-com bubble of the late 1990’s saw the stock market rise to dizzying heights. Excitement around the creation of the Internet lead to irrational exuberance with investors eager to pour new money into Internet-based start up companies. Many of these companies saw their valuations explode despite having no revenue, profit, or even a finished product. As funding began to dry up, many of these companies went under and brought the market down with them. The ensuing recession was exacerbated by the 9/11 attacks. During this time, the S&P 500 declined almost 50% while the tech-heavy NASDAQ dropped almost 78%. It did not regain that peak for another 15 years.
Although not quite as severe as the Great Depression, the bear market caused by the Great Recession was devastating. Leading up to the recession, lending standards were relaxed to the point where “NINJA” loans—given to people with no income, no job, no assets—became prevalent. Many borrowers were qualified based on the speculation that property values would continue to rise. To reduce risk, these loans were bundled into collateralized mortgage obligations (CMOs) with the assumption that they could not all default at once. When the housing market started to turn, many of these risky loans defaulted, taking down Bear Stearns and Lehman Brothers, two investment banks with heavy exposure to these products. The government had to step in and bail out several banks, insurers, and home mortgage agencies, Fannie Mae and Freddie Mac. US GDP contracted for three consecutive quarters and unemployment reached over 10%. The S&P 500 lost over half of its value and it took four years to reach a new high.
The shortest bear market on record occurred in 2020 during the COVID-19 pandemic. As the world went into lockdown, the S&P fell 34% in a little over a month but recouped all losses in less than five months. Unprecedented fiscal and monetary stimulus helped calm markets and a vaccine was created that fall.
Since WWII, the average drawdown of the S&P 500 during a bear market is 34% with the bottom reached at an average of 9.6 months. While rising inflation and interest rates are a common theme, the worst historical declines were caused by excessive use of leverage and heavy speculation. A typical Fed-induced recession bear market has seen declines between 20-25% with unemployment staying below 10%. How quickly inflation comes down and how resilient the labor market remains will likely determine if we have seen the bottom already or if stocks will test new lows.
It is important for investors to recognize that bear markets are a part of the natural cycle of economic expansion and contraction. This highlights the importance of maintaining a disciplined and diversified investment strategy with asset allocation in line with risk tolerance.
Individual investment positions detailed in this post should not be construed as a recommendation to purchase or sell the security. Past performance is not necessarily a guide to future performance. There are risks involved in investing, including possible loss of principal. This information is provided for informational purposes only and does not constitute a recommendation for any investment strategy, security or product described herein. Employees and/or owners of Nelson Capital Management, LLC may have a position securities mentioned in this post. Please contact us for a complete list of portfolio holdings. For additional information please contact us at 650-322-4000.
Receive our next post in your inbox.