Nelson Capital Management


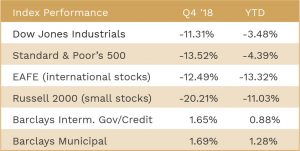
 Volatility reignited in the fall, following a relatively quiet spring and summer. In the fourth quarter, the index moved more than 1% on 28 out of 63 total trading days, compared to zero days over 1% in the third quarter. Most of these moves were to the downside, as the S&P 500 fell 13.5% from the end of September, erasing all gains that the index had seen up to that point, and bringing the year-to-date decline to 4.4%. Markets tend to hate uncertainty, and there was plenty of it in the last few months of the year. The trade conflict with China, the breakdown in Brexit negotiations, the government shutdown, the Mueller investigation, oil prices in freefall, geopolitical concerns over the withdrawal from Syria, high-profile Trump administration departures, and shrinking global growth forecasts were all sources of anxiety.
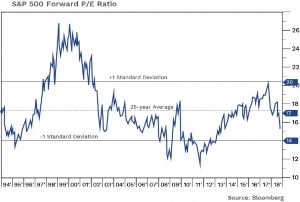
Meanwhile, economic data exhibited a robust labor market, with low unemployment and rising wages, while corporate earnings achieved their 20% growth forecast for the year.  The S&P 500’s drop in 2018 alongside the significant increase in earnings translated to a considerable valuation decline. Indeed, the S&P 500 trailing price-to-earnings ratio fell 22%, from 21.9 at the start of the year to 17.1 at the end.
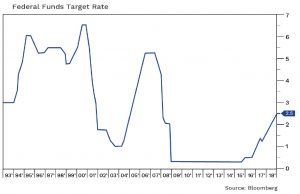
Of all the tea leaves, perhaps none were more carefully studied than those from the Federal Reserve. At its final meeting of the year, the Fed raised its benchmark Federal Funds Target rate to 2.5%, as was widely expected. It also signaled that it will slow its rate hike program in 2019, with only two rate hikes planned, following four in 2018. Furthermore, the Fed maintained that it will remain “data dependent,” meaning that it will react accordingly if it sees signs of a slowdown in the economy. Nevertheless, the Fed anticipates that the tight labor market will ultimately cause inflationary pressure, which is why it decided not to take a dramatic pause in its interest rate hikes or to disrupt the current pace of unwinding its balance sheet.
 Inflation has thus far remained benign in the current bull market. The Fed measures inflation primarily with the Personal Consumption Expenditures (PCE) price index. Rising wages, increasing freight costs and higher input prices have helped firm inflation, while falling oil, global growth concerns and a softening housing market are acting as buffers, keeping inflation from running away.
David Brancaccio, host of American Public Media’s “Marketplace,” analogized that if the U.S. economy is the ocean, then the Federal Reserve might be the moon. The Fed’s monetary policy controls the economic “tides.” The Fed’s four rate increases this year have led to higher short-term interest rates and an even flatter yield curve. Much ado has been made in the headlines about the traditional recession harbinger, the yield curve “inversion,” that occurred near the end of the year. The 2-year yield did indeed trade higher than the 5-year yield—by 0.02%. But this inversion is miniscule compared to the one that occurred at the end of 2006, when the entire curve was inverted and the 2-year Treasury was yielding nearly 20 basis points more than the 5-year Treasury. Even then, it took a full 18 months after that for a recession to materialize. We do predict that we will see a more genuine yield curve inversion in 2019, and if this is coupled with a slowdown in payrolls, we think the next recession will follow 6 to 18 months later, as it usually does. We continue to monitor the spread between the 2- and 10-year Treasury yields as well as the year-over-year job growth rate.
 We maintain our belief that the next recession will be caused by the Fed overtightening, or raising rates to a point where economic growth is impacted. However, we are surprised at the strong negative reaction in the market given a low 2.5% benchmark rate and the measured, cautious approach the Fed demonstrated at its last meeting. But just as the ocean has its own currents and waves that act independent of the tides, the markets have their own idiosyncrasies that cause near-term volatility. While we remain fully invested at this time, we have begun to pivot toward defensive stocks that should hold up well in a recession. These include companies whose revenue is less dependent on robust macroeconomic growth as well as value stocks that have low valuations and high dividend yields. We have also added more 2-year Treasury notes and money market funds, including the Schwab Value Advantage Money Fund (tkr: SWVXX), to our client portfolios. Nevertheless, we still remain overweighted in equities relative to fixed income. Currently, our client portfolios are roughly 75% equities and 25% fixed income. By comparison, in 2004 that split was closer to 50/50.
The next step in our pivot will be to increase our fixed income exposure and decrease our equity exposure. Eventually, we will look to add more to our international equity weighting, but we see too much risk and uncertainty in international markets to warrant a heavier weighting at this time.
Individual investment positions detailed in this post should not be construed as a recommendation to purchase or sell the security. Past performance is not necessarily a guide to future performance. There are risks involved in investing, including possible loss of principal. This information is provided for informational purposes only and does not constitute a recommendation for any investment strategy, security or product described herein. Employees and/or owners of Nelson Roberts Investment Advisors, LLC may have a position securities mentioned in this post. Please contact us for a complete list of portfolio holdings. For additional information please contact us at 650-322-4000.
Receive our next post in your inbox.