Nelson Capital Management


 The second quarter of the year saw building optimism that the US economy is on track to achieve a soft landing. The S&P 500 is up 15% since the start of the year and has logged 30 new all-time highs during that time. Returns have been driven by continued strength in the “Magnificent 7” (Alphabet, Amazon, Apple, Meta, Microsoft, Nvidia and Tesla), particularly those that are benefiting from the secular AI tailwind (Nvidia, Meta, Amazon, Microsoft). The remaining 493 stocks in the index saw returns that were markedly less impressive, albeit still positive.
Investors breathed a collective sigh of relief as the April and May inflation data came in lower than expected, reversing a trend of hotter-than-expected inflation data in the first three months of the year. A decline in core goods helped pull the overall Consumer Price Index (CPI) down to 3.3%, although the largest weight—the shelter component—remains stubbornly sticky, keeping inflation above the Fed’s 2% target. While inflation appears to be trending lower, the labor market remains relatively unaffected by higher interest rates. The US has added an average of about 250,000 jobs per month since the start of the year, compared to an average of about 195,000 jobs per month added between the Great Financial Crisis and the pandemic. Unemployment inched higher according to the latest labor market report, from 3.7% at the start of the year to 4.0% at the latest reading, a level that most economists consider full employment.
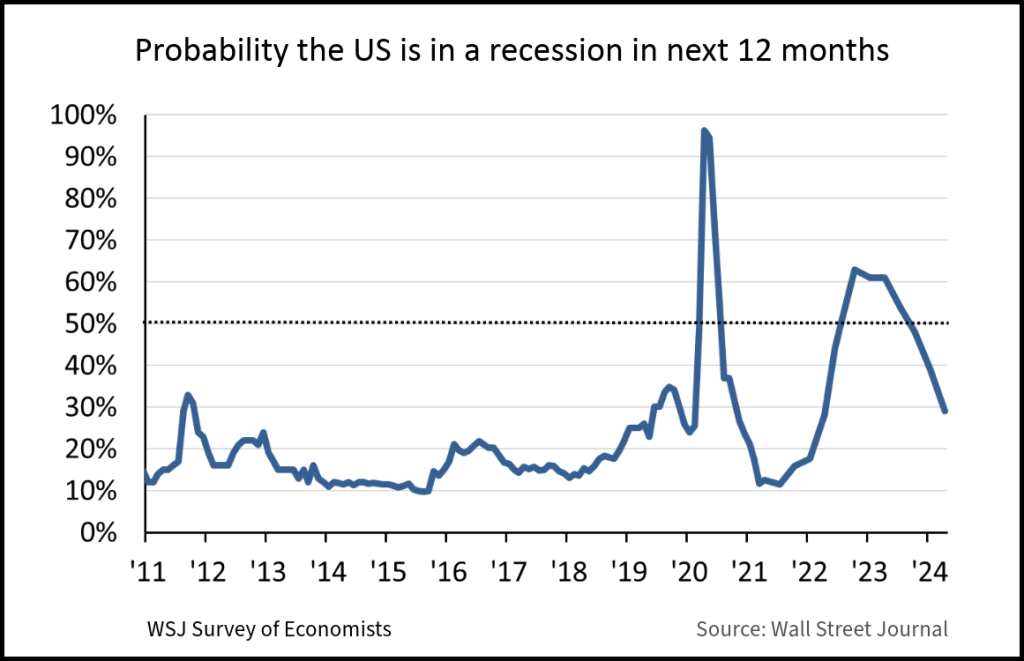
The latest quarterly survey conducted by the Wall Street Journal revealed that business and academic economists now see a 29% chance of a recession within the next year, down from 39% in the January survey and a stark reversal from the 61% surveyed a year prior. The “Goldilocks” data has led the market to expect that the Federal Reserve will soon be able to begin cutting its benchmark target rate.
 While inflation is trending lower and the labor market remains resilient, other macroeconomic data has been noisy. Auto and credit card loan delinquencies are at 15-year highs as lower income consumers have felt the pinch of inflation. Aside from a few standouts, consumer retailing company management has sounded a very cautious tone, indicating that consumers of all income levels are becoming more cautious and price sensitive. Most travel companies, on the other hand, geared up for record travel over the July 4th holiday as consumers continue to shell out on travel and experiences. Manufacturing data, though it seems to have bottomed out, remains in contraction territory.
These datapoints seem to contradict one another. They create a confusing picture of consumer behavior and the equity markets. In this new era of higher rates, we are noticing splits develop between wealth and less wealthy consumers. A consumer in a higher income bracket with a healthy retirement account balance and investments in a brokerage account is profiting from record market levels as well as elevated interest payments from any bond investments. This consumer also probably owns their home, on which they may have even locked in a 2020-era 30-year fixed mortgage with a ~3% rate. Meanwhile, a consumer in a lower income bracket who typically spends a higher percentage of their take-home pay on basic necessities is feeling particularly pinched by higher inflation. This is also the consumer who is likely to have auto or credit card debt outstanding, the latter of which carries a variable interest rate upwards of 20%. This consumer is unlikely to have much in the way of investments, and so they have not benefited from the market returns or home price appreciation we have witnessed over the past few years.
In our view consensus expectations, which were overly negative a year ago, are now ignoring the noisy data, the lofty valuations in the concentrated part of the equity markets, and the credit issues of below median consumers.
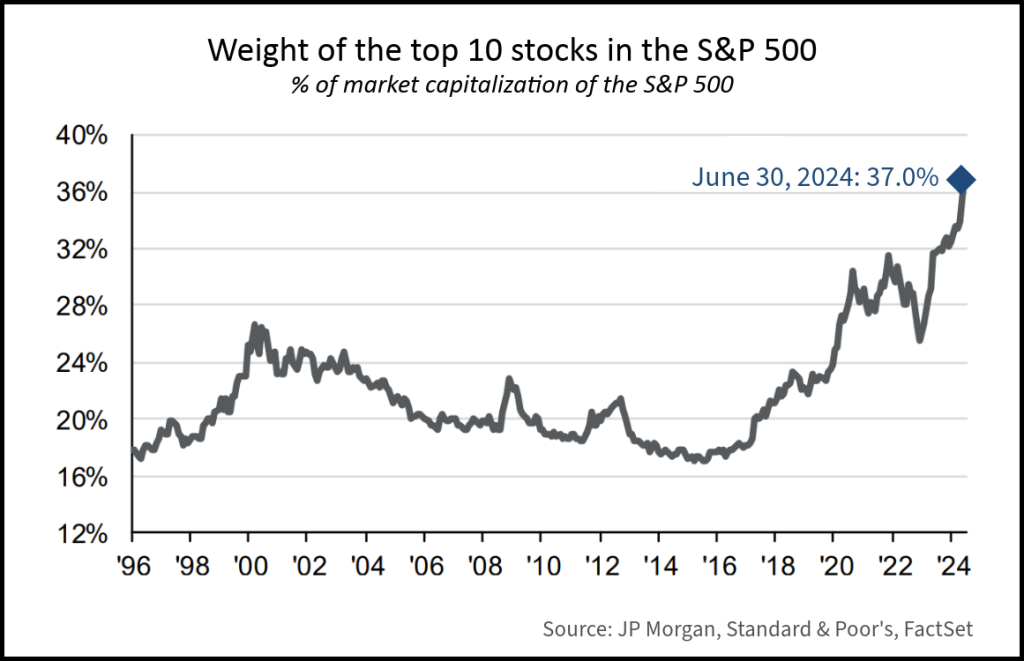
Similarly, in the equity markets, a relatively established company with a fortress balance sheet and robust free cash flow (which would describe most of the Magnificent 7 companies) is not terribly affected by higher borrowing costs. Conversely, a not-yet-profitable small company trying to stay afloat must now borrow money at ever higher interest rates, putting pressure on its bottom line. Furthermore, the AI tailwind has driven several of the top companies in the S&P 500 to dazzling new highs. The Magnificent 7 group is collectively up 32% since the start of the year, while the S&P 500 excluding these 7 companies is only up about 6%. There are plenty of reasons to be excited about these companies (productivity gains in AI, easy access to cash to fuel growth), but it is important to keep an eye on the concentration that has developed in this index. The top 10 stocks now make up over 37% of the market cap of the S&P 500. A decade ago, the top 10 companies made up about 17% of the index. Even at the height of the dot-com bubble, the top 10 made up only about 26% of the index.

Concentration alone is not necessarily cause for concern. However, it does mean that something bad happening to one of these top 10 companies will have a disproportionate effect on the overall index. We would also note that the top 10 stocks have a current forward price-to-earnings ratio of about 28x, roughly 38% higher than average. The current forward price-to-earnings ratio of the remaining stocks in the index is about 17.6x, about 12% higher than average.
In our view consensus expectations, which were overly negative a year ago, are now ignoring the noisy data, the lofty valuations in the concentrated part of the equity markets, and the credit issues of below median consumers. We remain hopeful that the US is on track to achieve a soft landing. Nevertheless, we are keeping an eye on the contradictory data and watching for any sign of inflation reigniting, which we believe would put pressure on elevated equity market valuations as it would push out the timing of any rate cuts by the Fed. We maintain broad exposure to all sectors while we monitor any signs of slowing growth or consumers pulling back on spending. Skewed data could be painting a rosier growth picture than what is actually happening for most consumers.
Individual investment positions detailed in this post should not be construed as a recommendation to purchase or sell the security. Past performance is not necessarily a guide to future performance. There are risks involved in investing, including possible loss of principal. This information is provided for informational purposes only and does not constitute a recommendation for any investment strategy, security or product described herein. Employees and/or owners of Nelson Capital Management, LLC may have a position securities mentioned in this post. Please contact us for a complete list of portfolio holdings. For additional information please contact us at 650-322-4000.
Receive our next post in your inbox.